Ctadel, screen by screen
Real captures of the demonstration application, on fictitious data. Follow them in the order a security lead goes through them: the situation first, then one finding, then the path that leads to it, then each module.
- 1
The situation on one screen
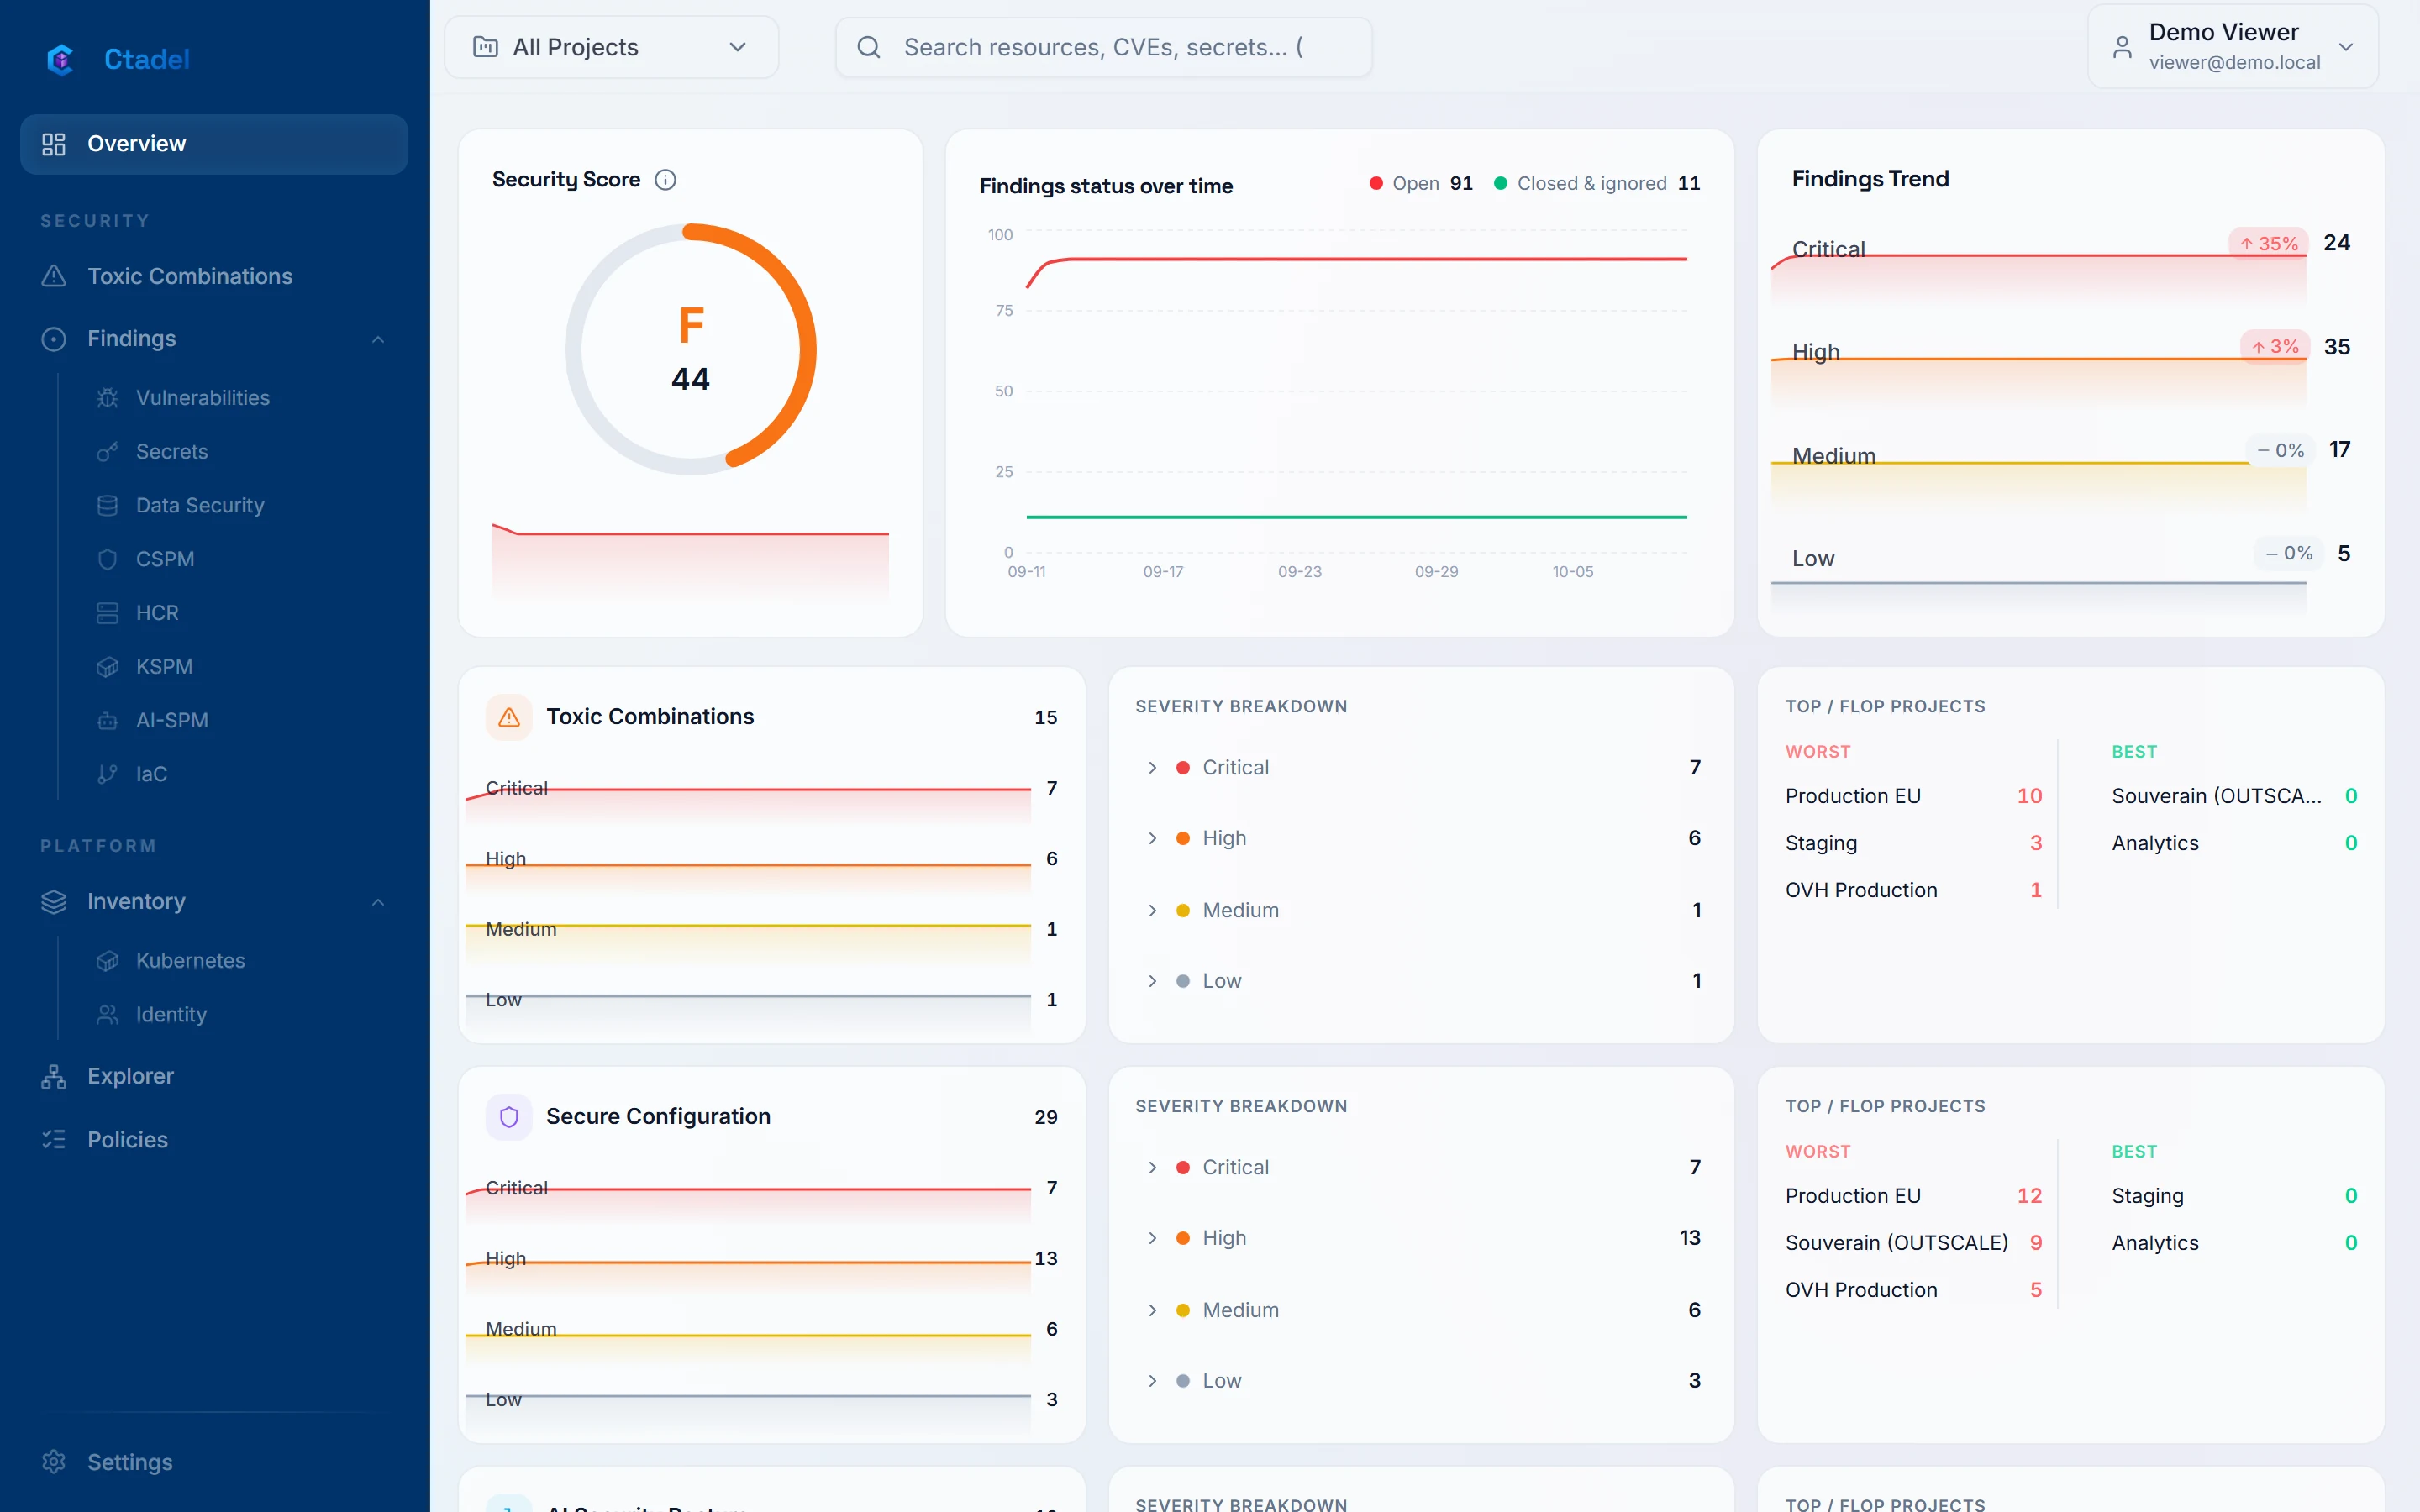
Overall score, breakdown by severity, open and closed findings, and their day-by-day history rebuilt from discovery and closure dates. This is the committee screen: what moved since last time, and why.
- 2
One list for ten modules
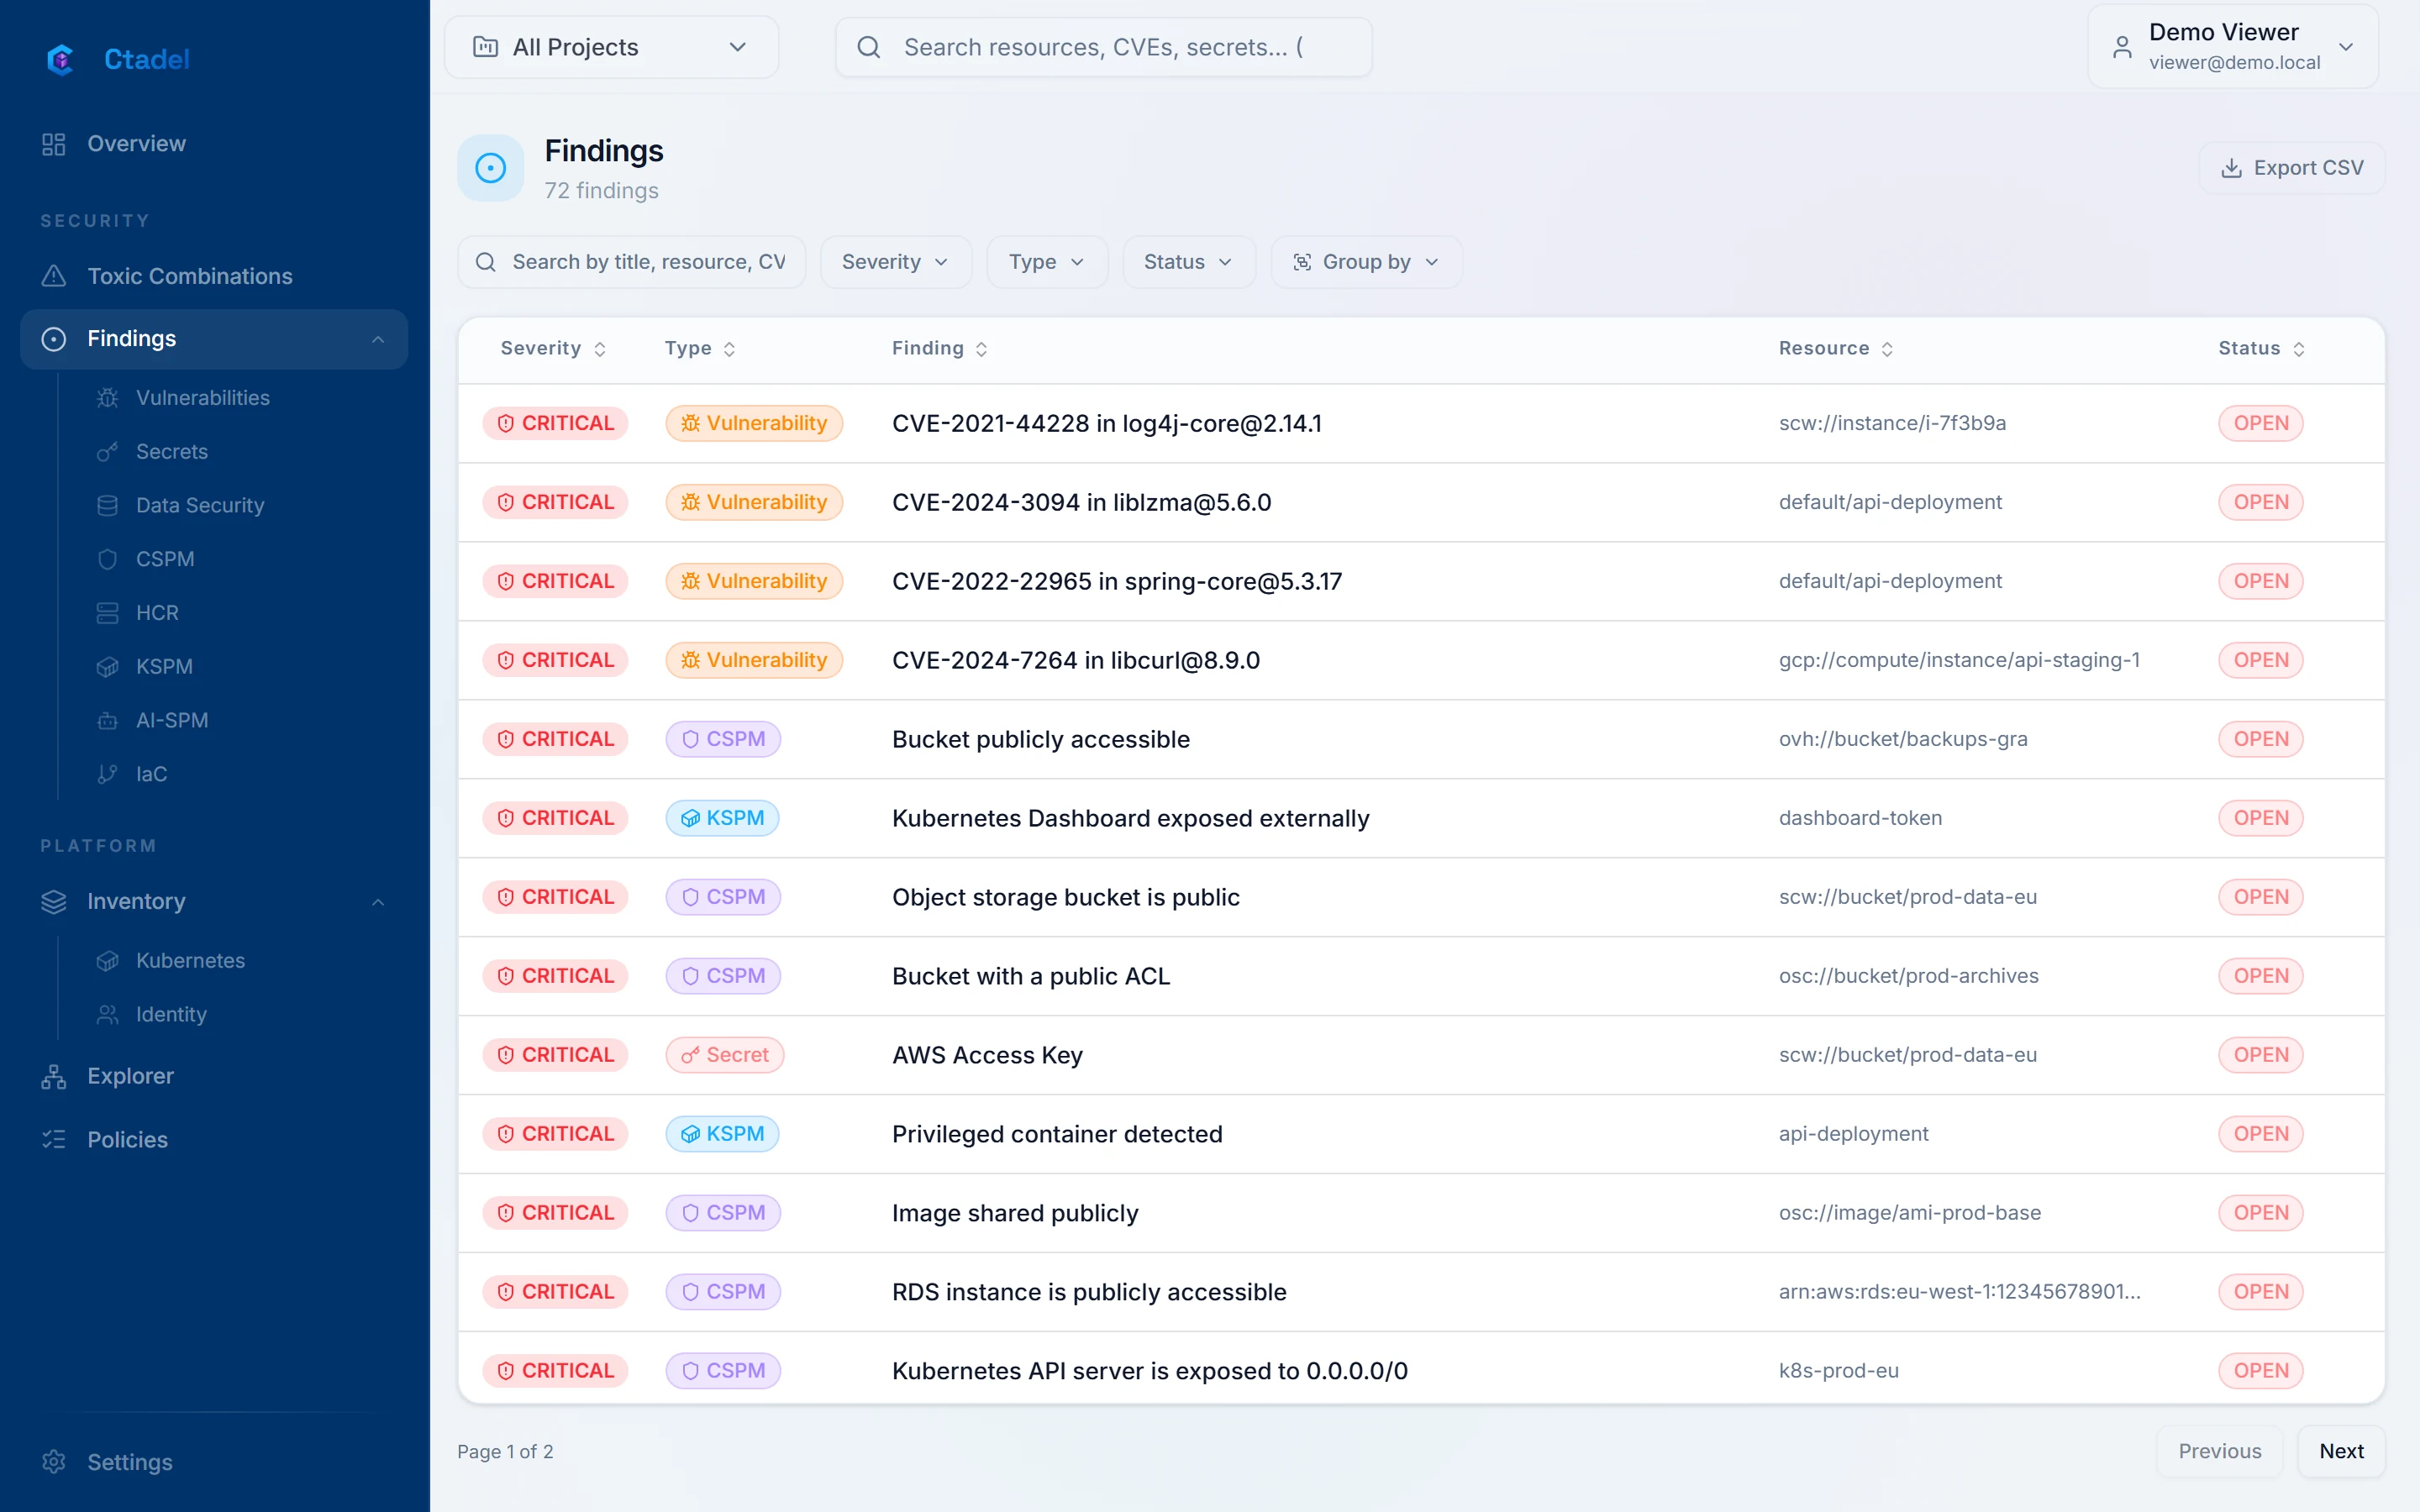
Configuration, identities, data, Kubernetes, hosts, vulnerabilities, secrets and code land in the same list, with the same severity scale and the same filters. Each row opens on the resource, the rule, the detection logic, the compliance references and the fix.
- 3
The chain, link by link
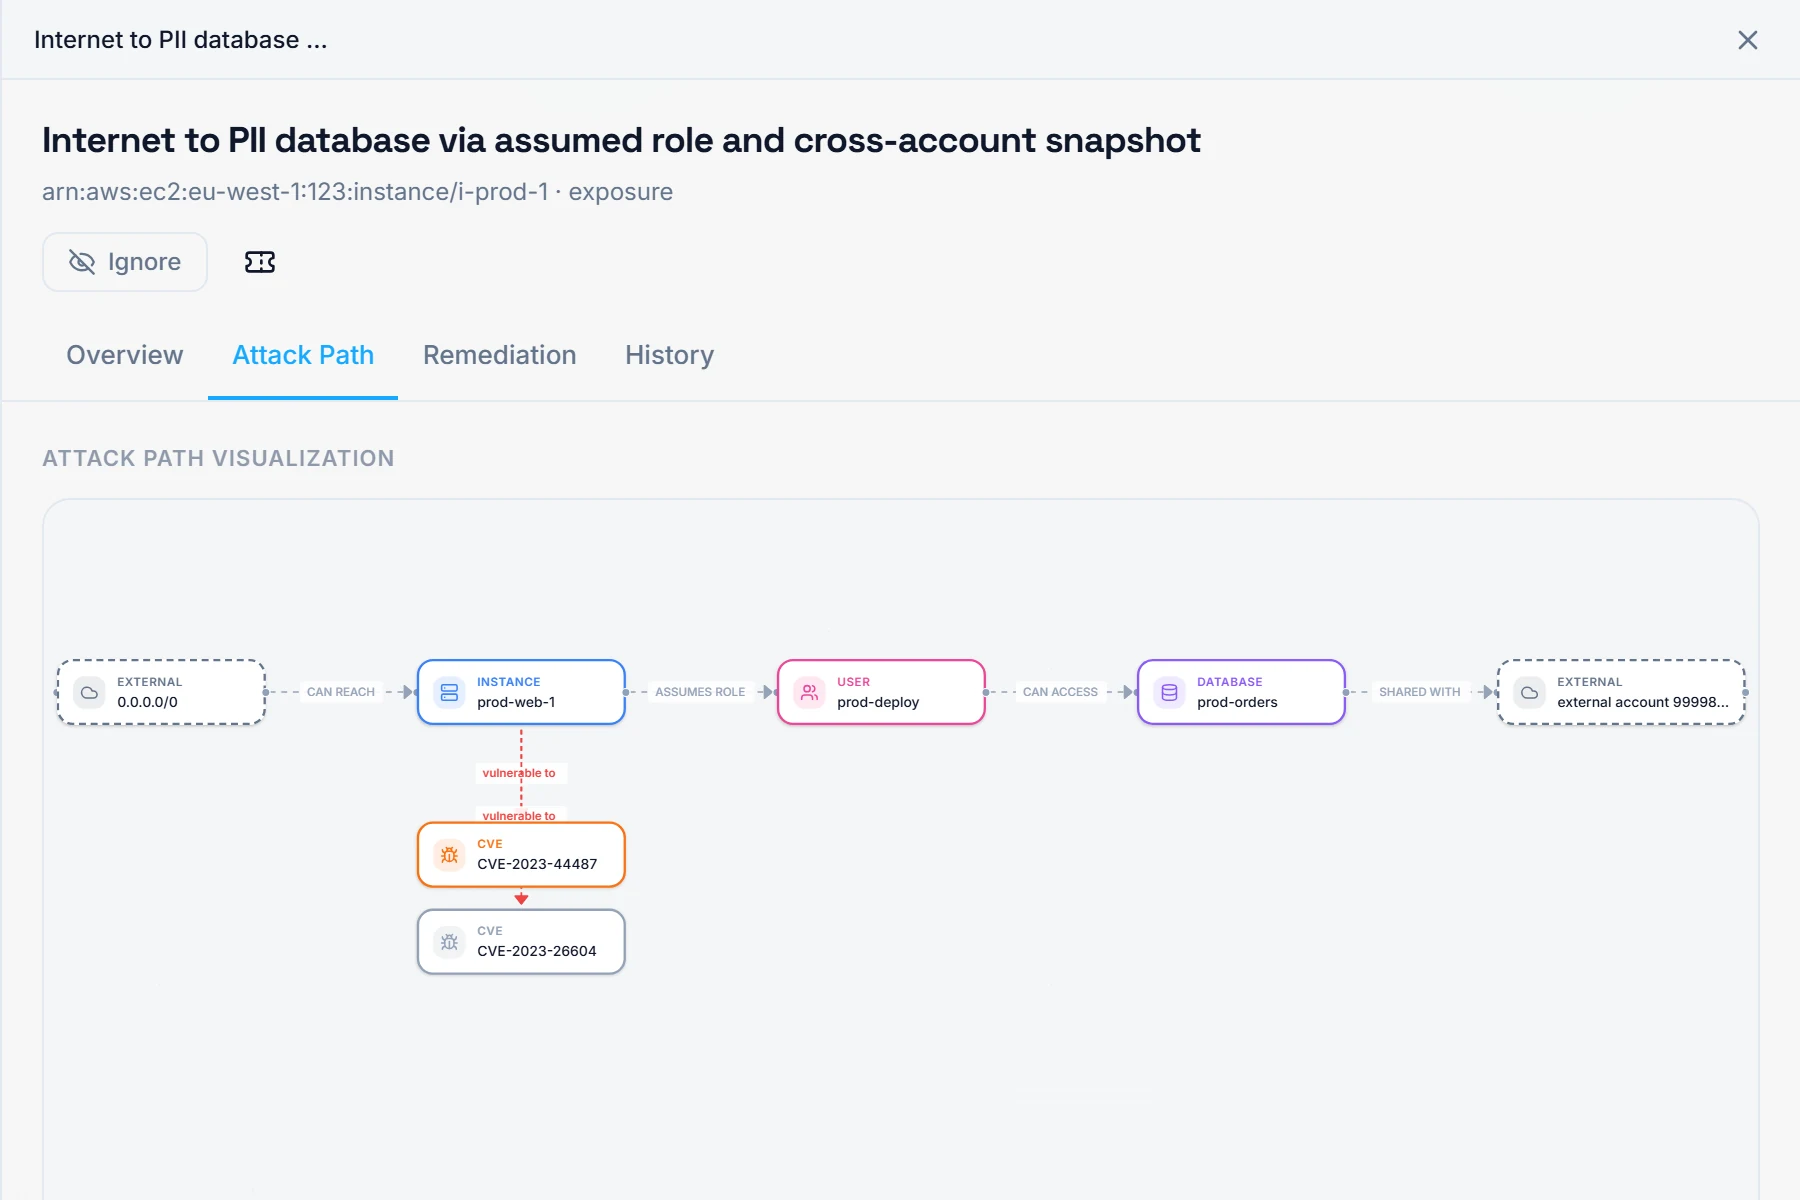
An attack path connects real resources: an exposure, a vulnerability, a permission, a piece of data. Here, seven links lead from the internet to a database of personal data through an assumed role and a snapshot shared with another account. The remediation tab says which link to break to close the path.
- 4
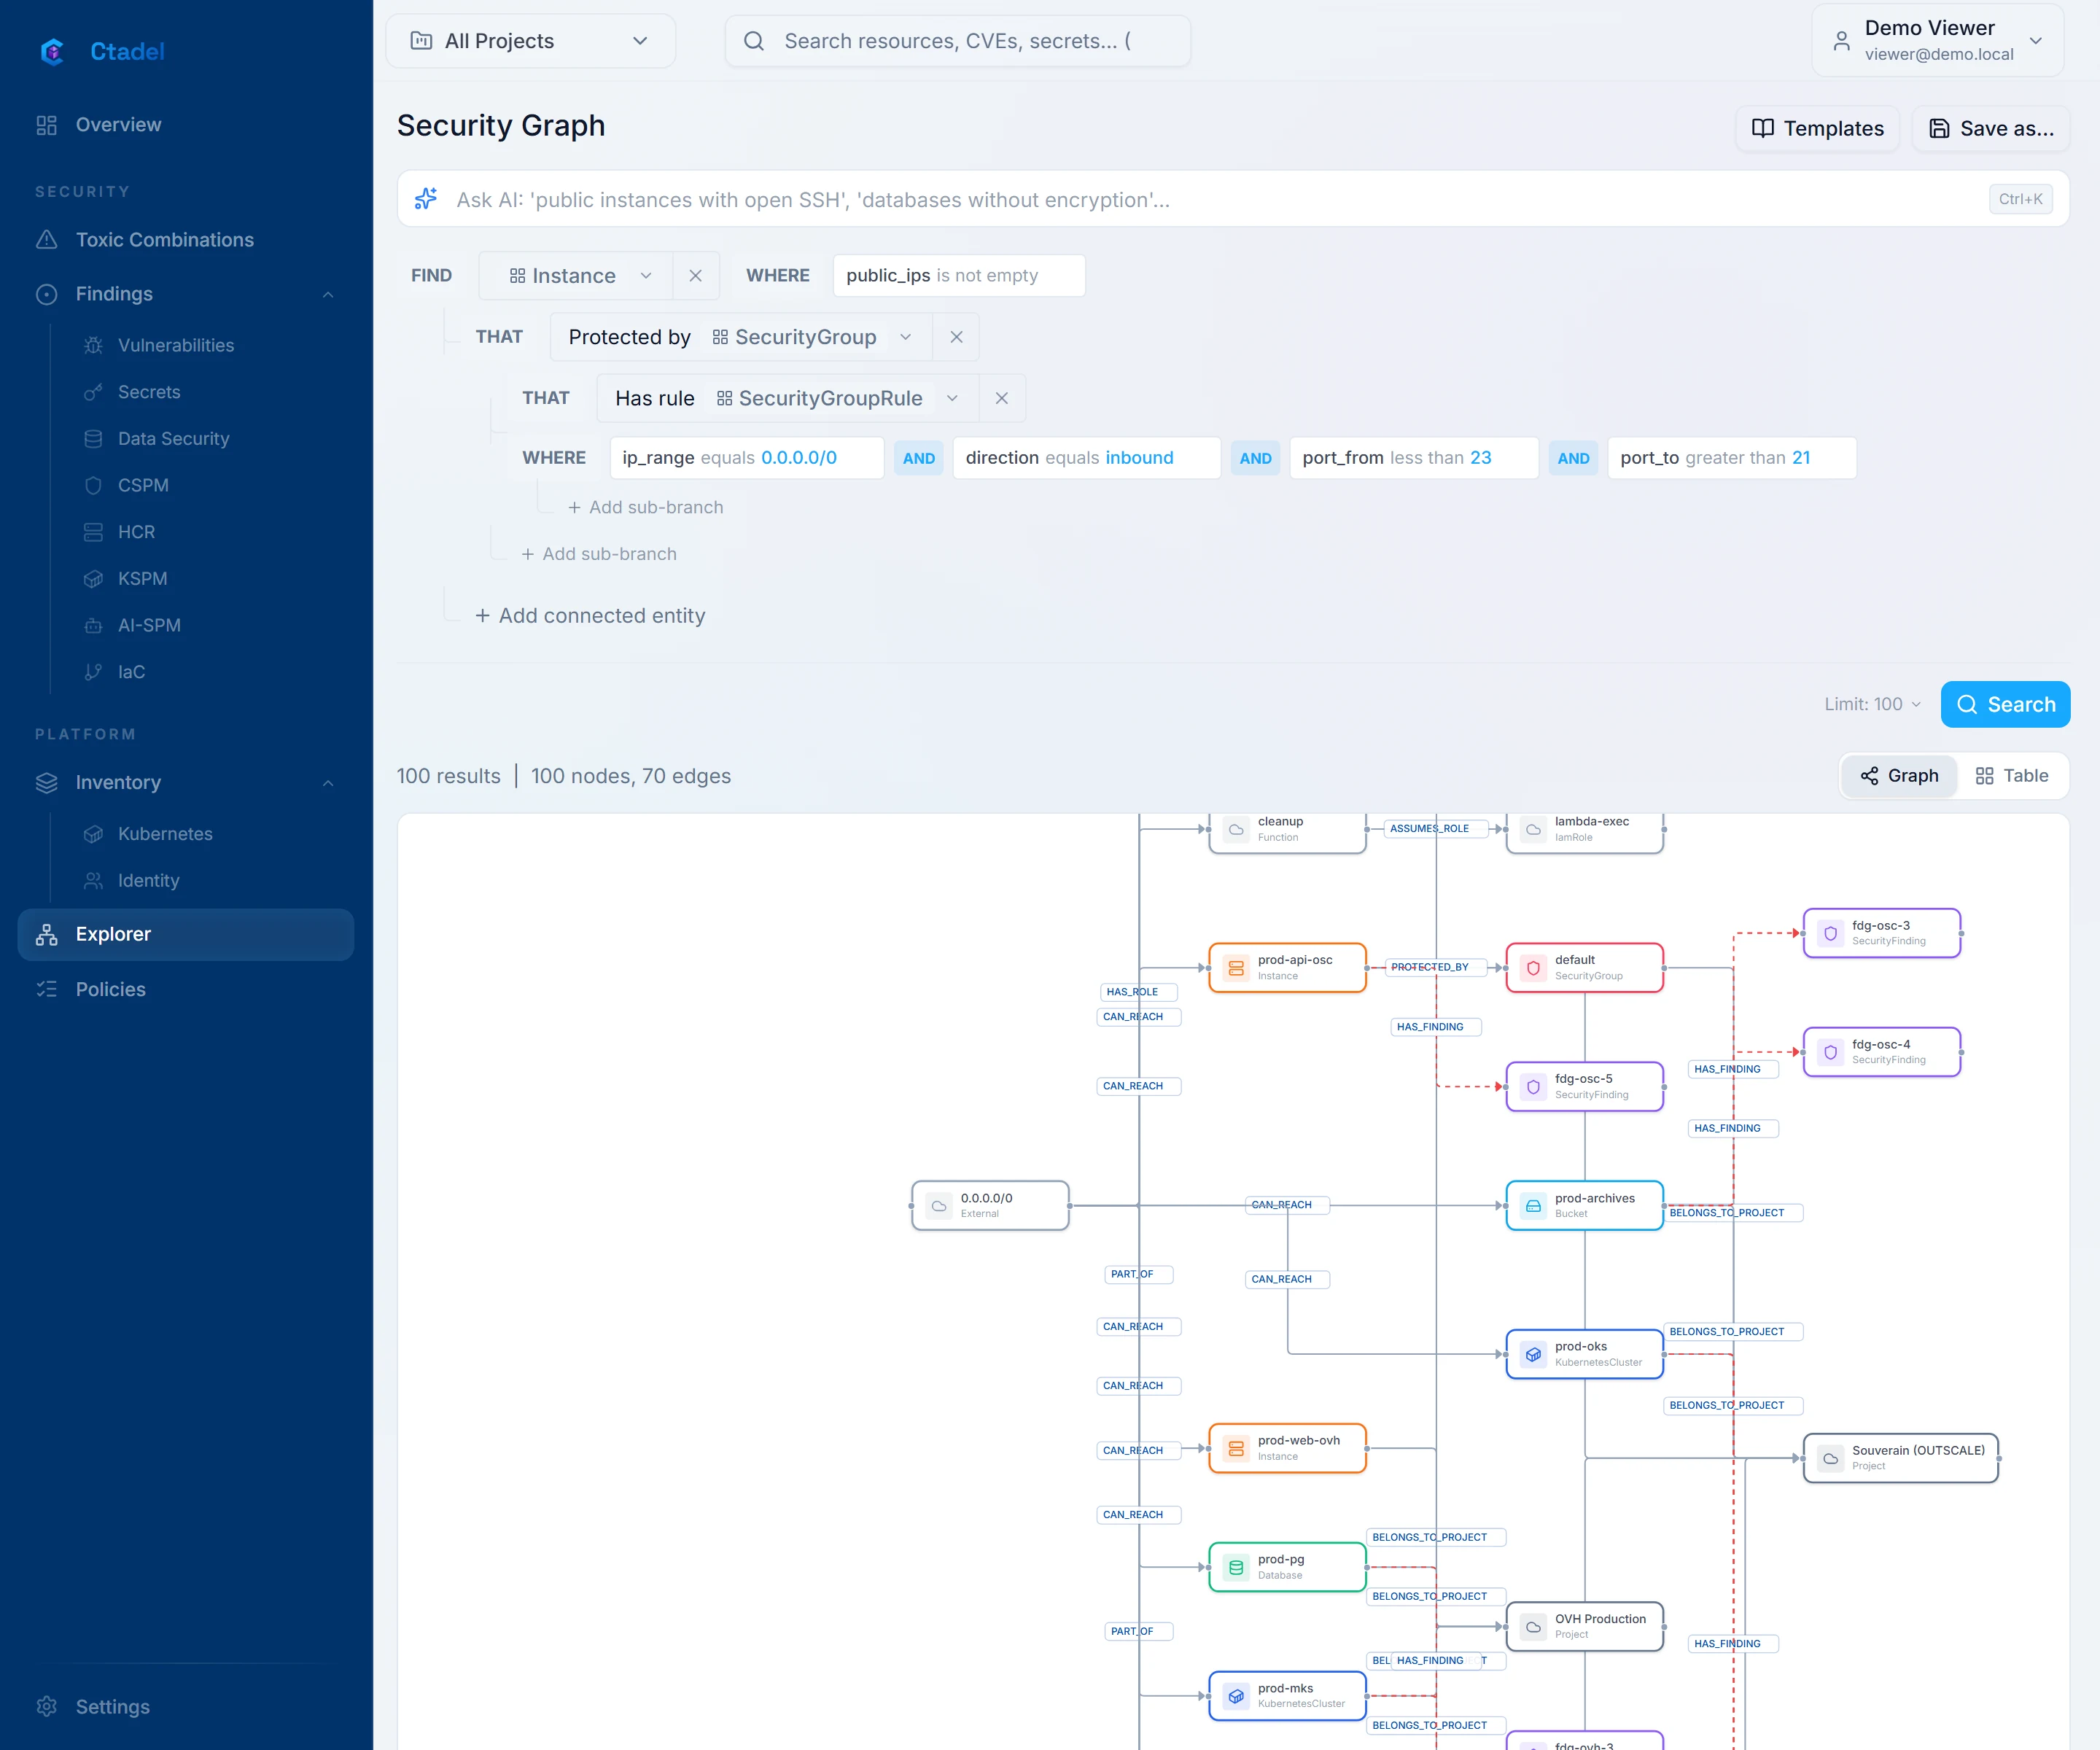
The graph, as it is
Everything Ctadel reads enters a graph: an instance belongs to a network, carries a role, reads a bucket, runs an image. The explorer walks it with ready-made queries or your own, relationship by relationship, to check each step before fixing.
- 5
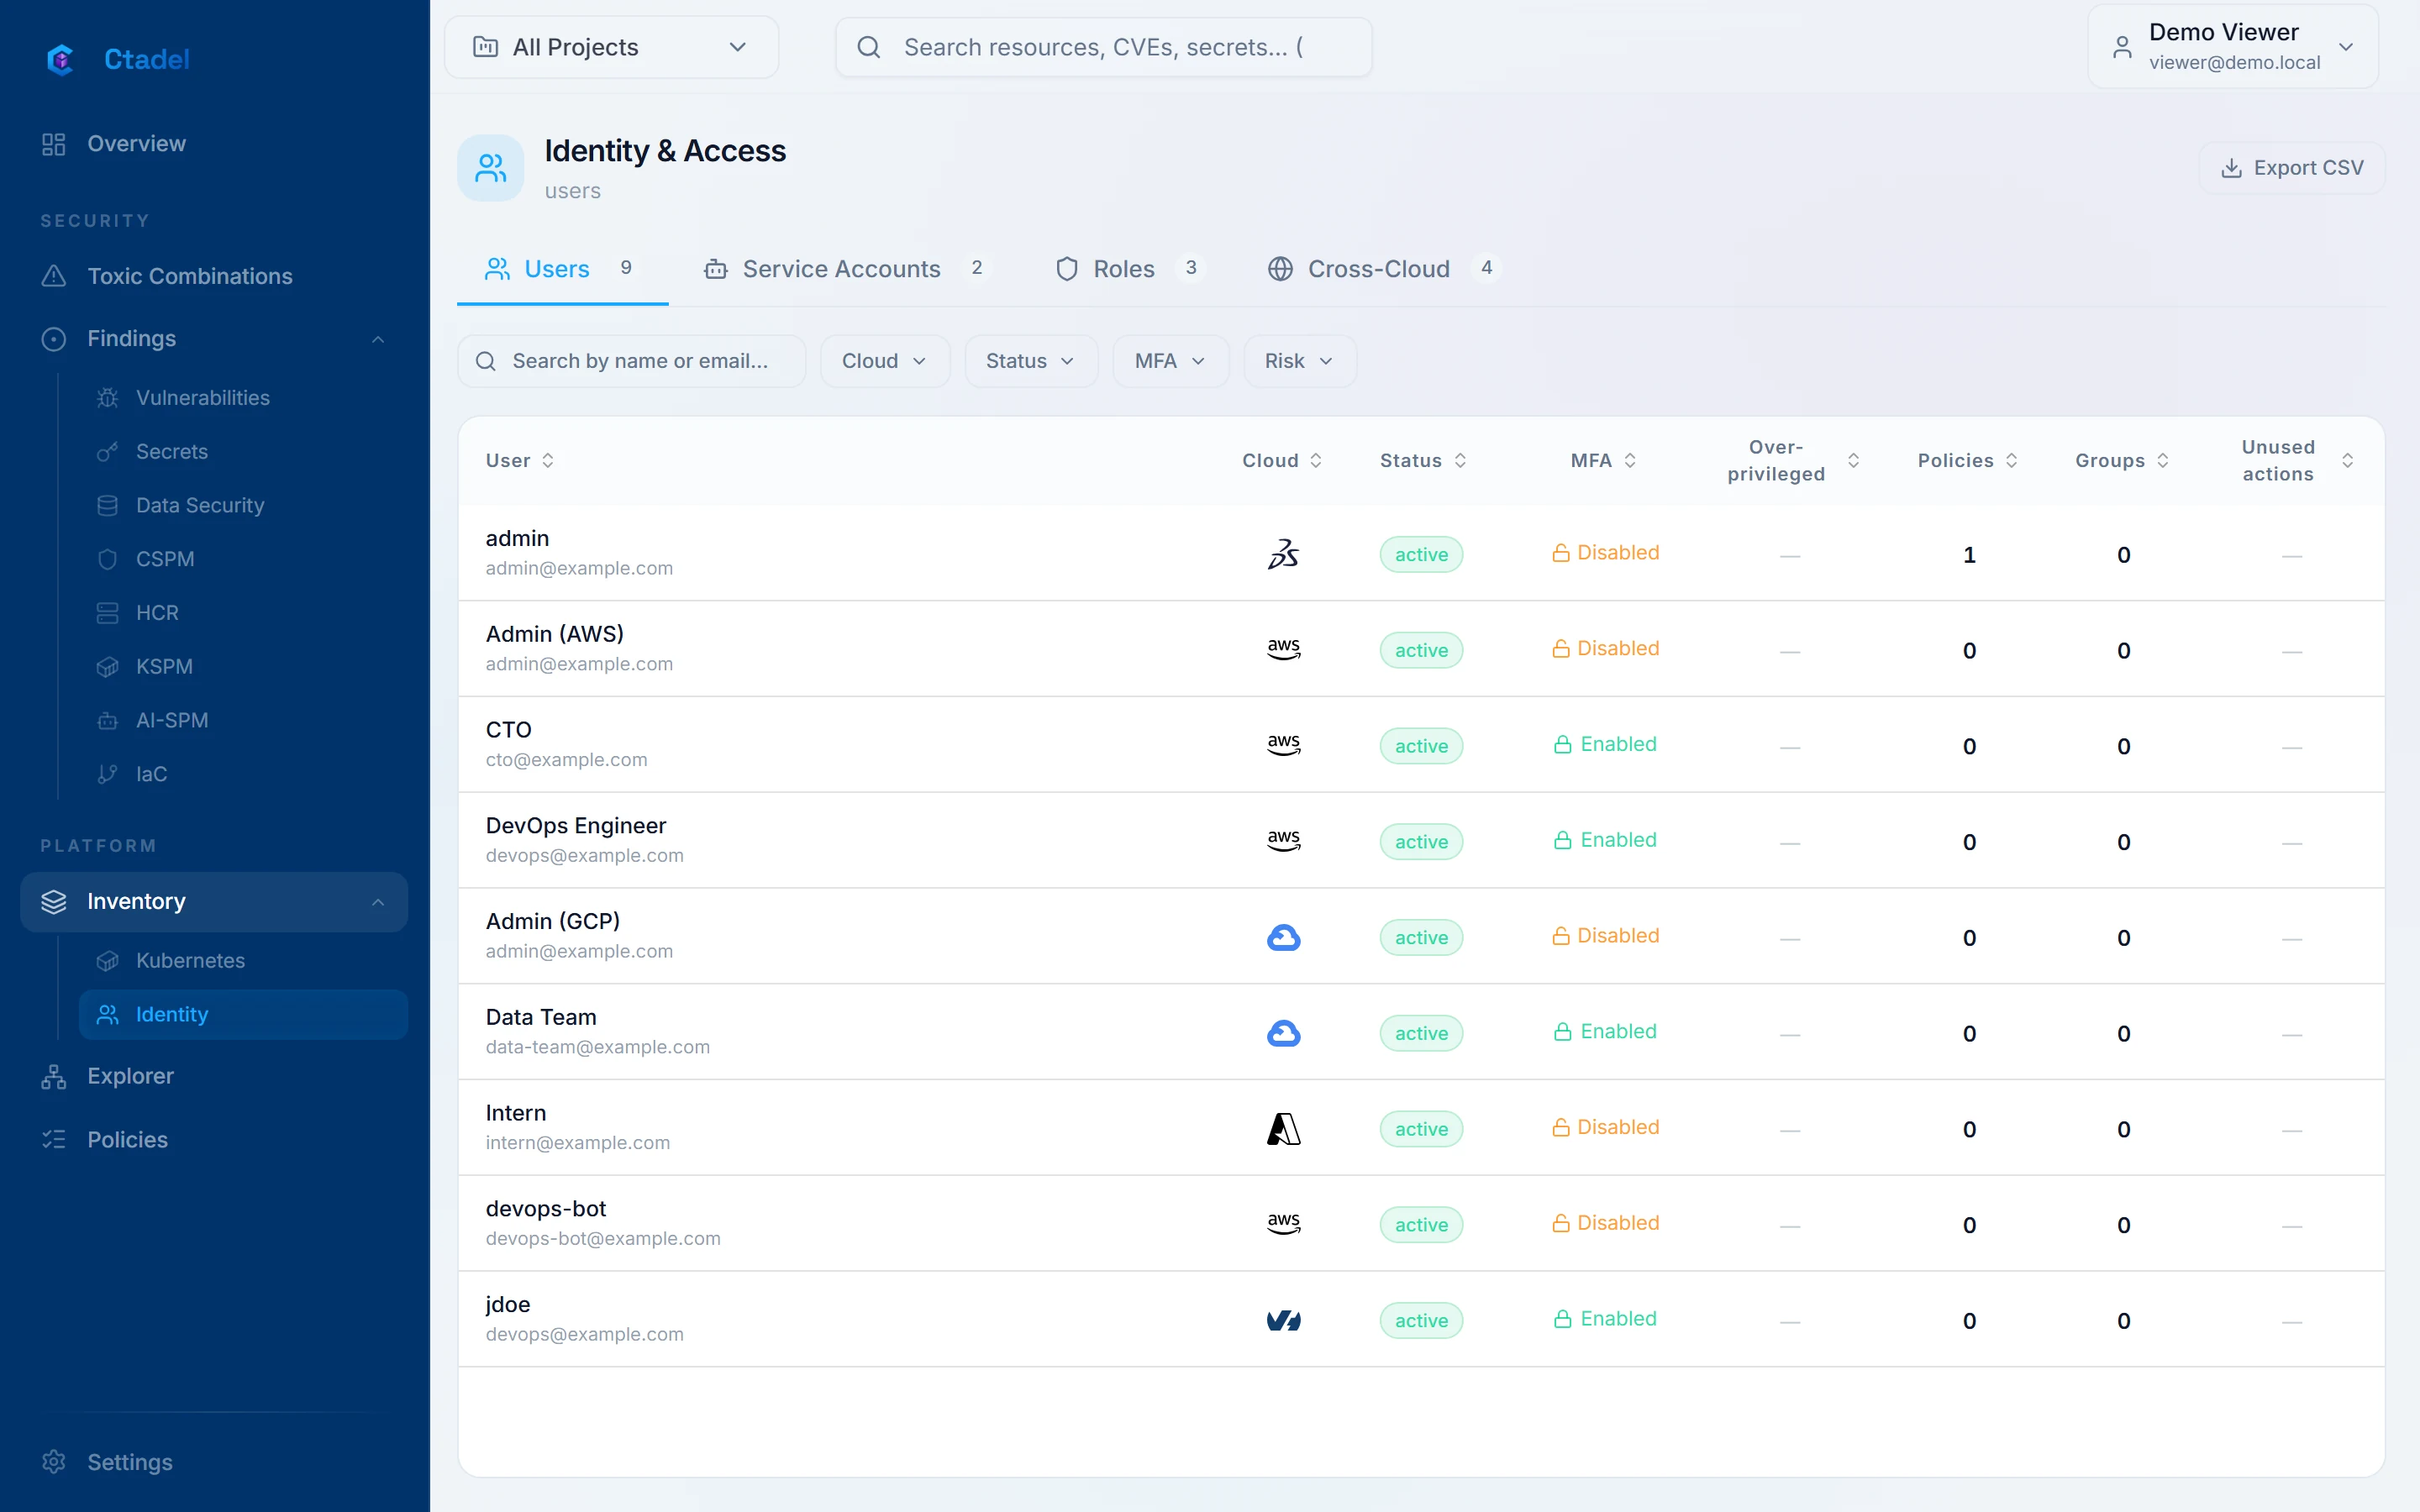
Effective permissions, not declared ones
Users, roles and service accounts of the six clouds, with what they can really do, what they never use, and the identities that exist on several clouds at once.
- 6
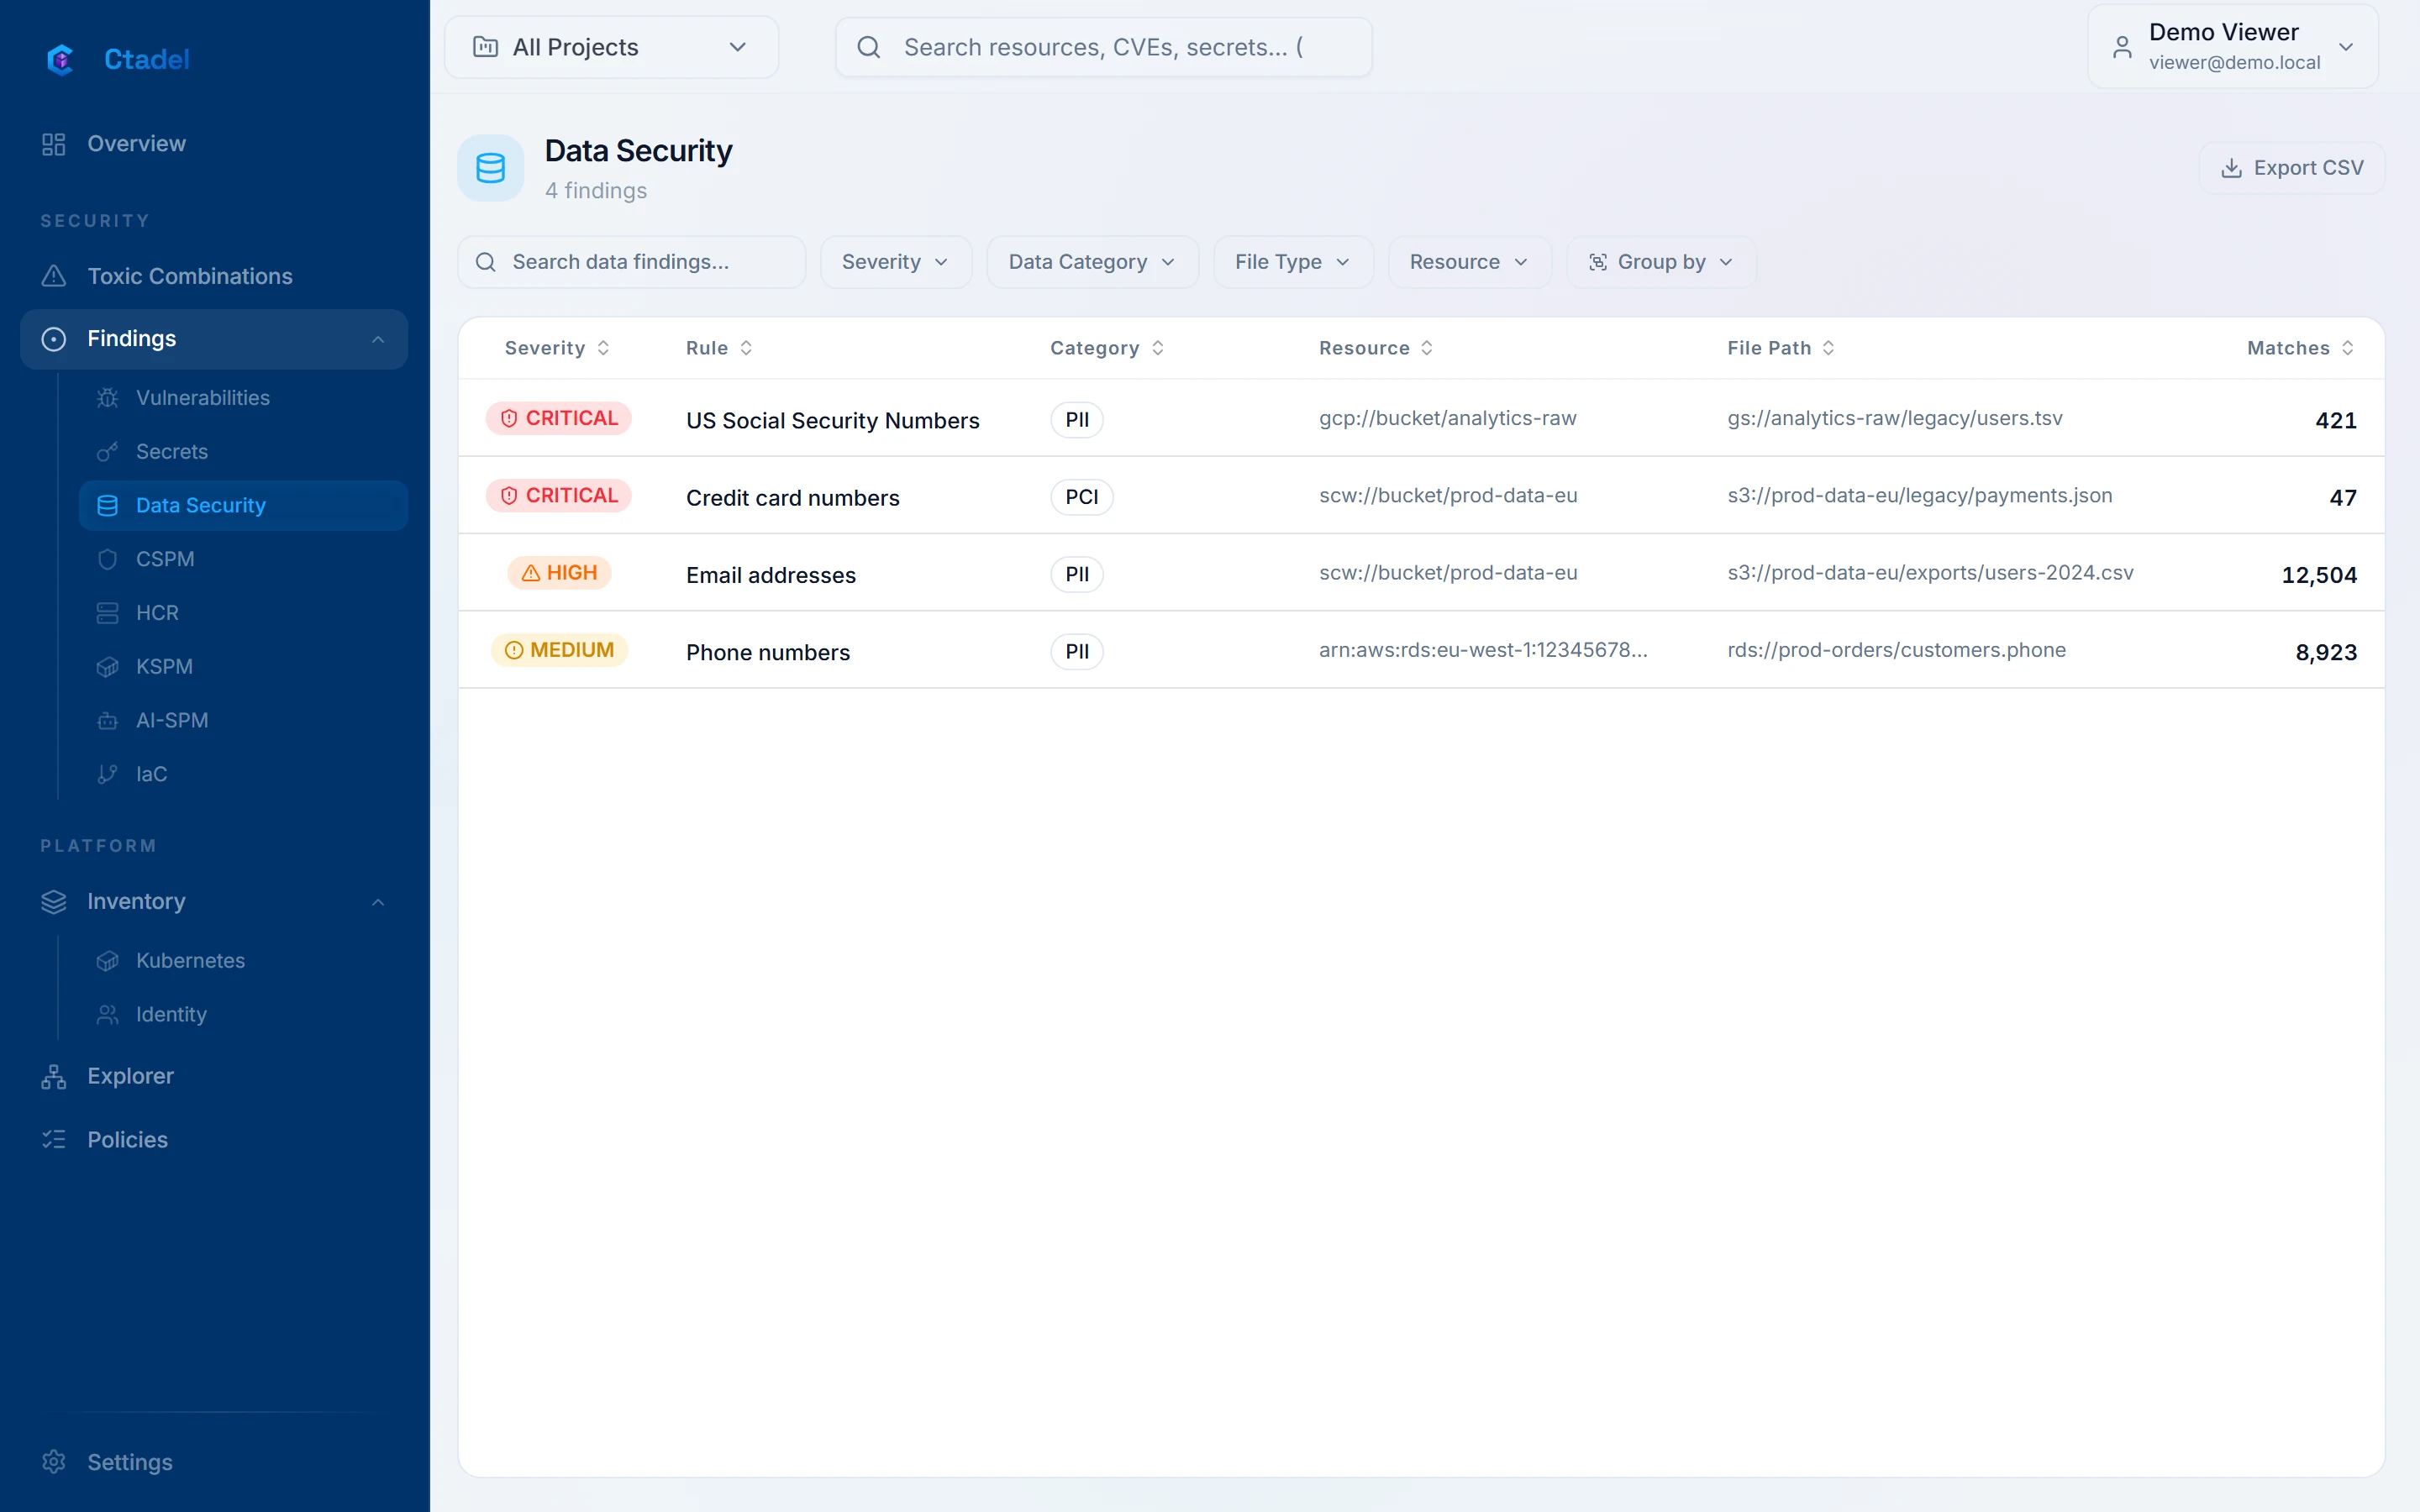
What buckets and databases really contain
Personal, banking, health data and secrets found in objects and tables, by category, with masked excerpts and an estimated volume per resource. Databases are read on a temporary copy inside your account, destroyed afterwards.
- 7
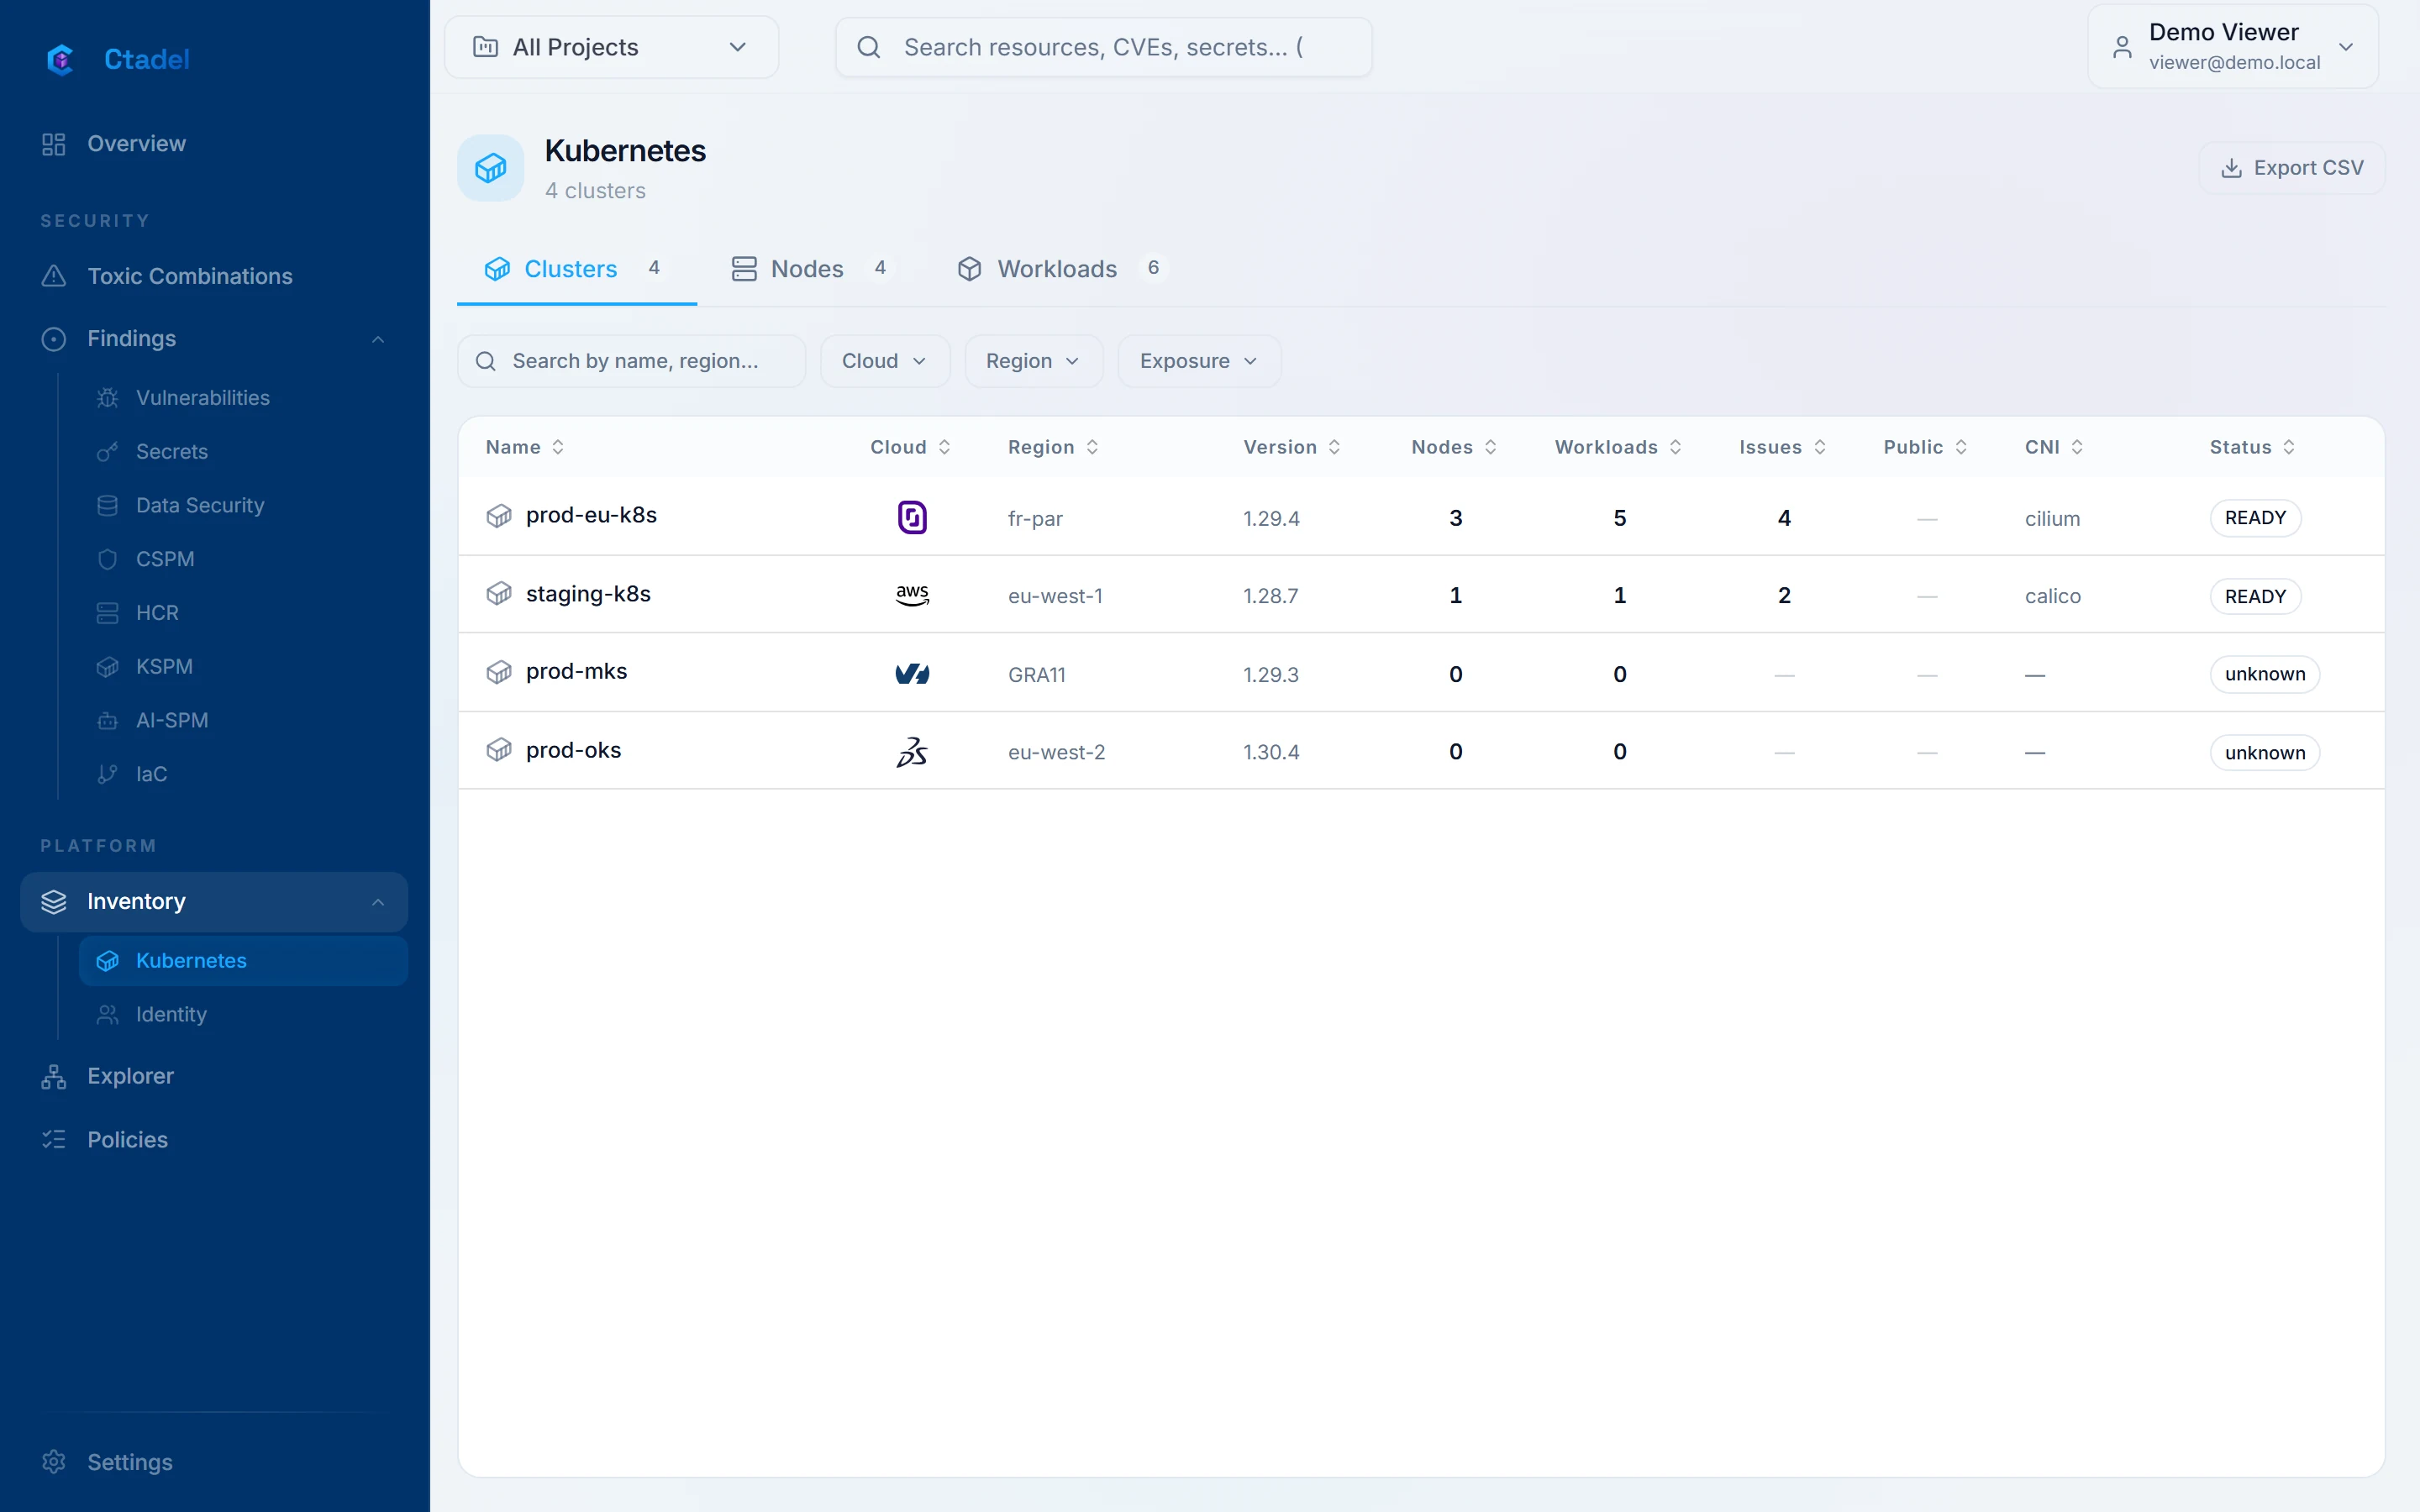
Clusters, nodes, workloads
EKS, AKS, GKE, Kapsule, MKS and OKS read through their API with a dedicated read-only group. Workloads, service accounts, RBAC, network policies and images, with the vulnerabilities of those images.
- 8
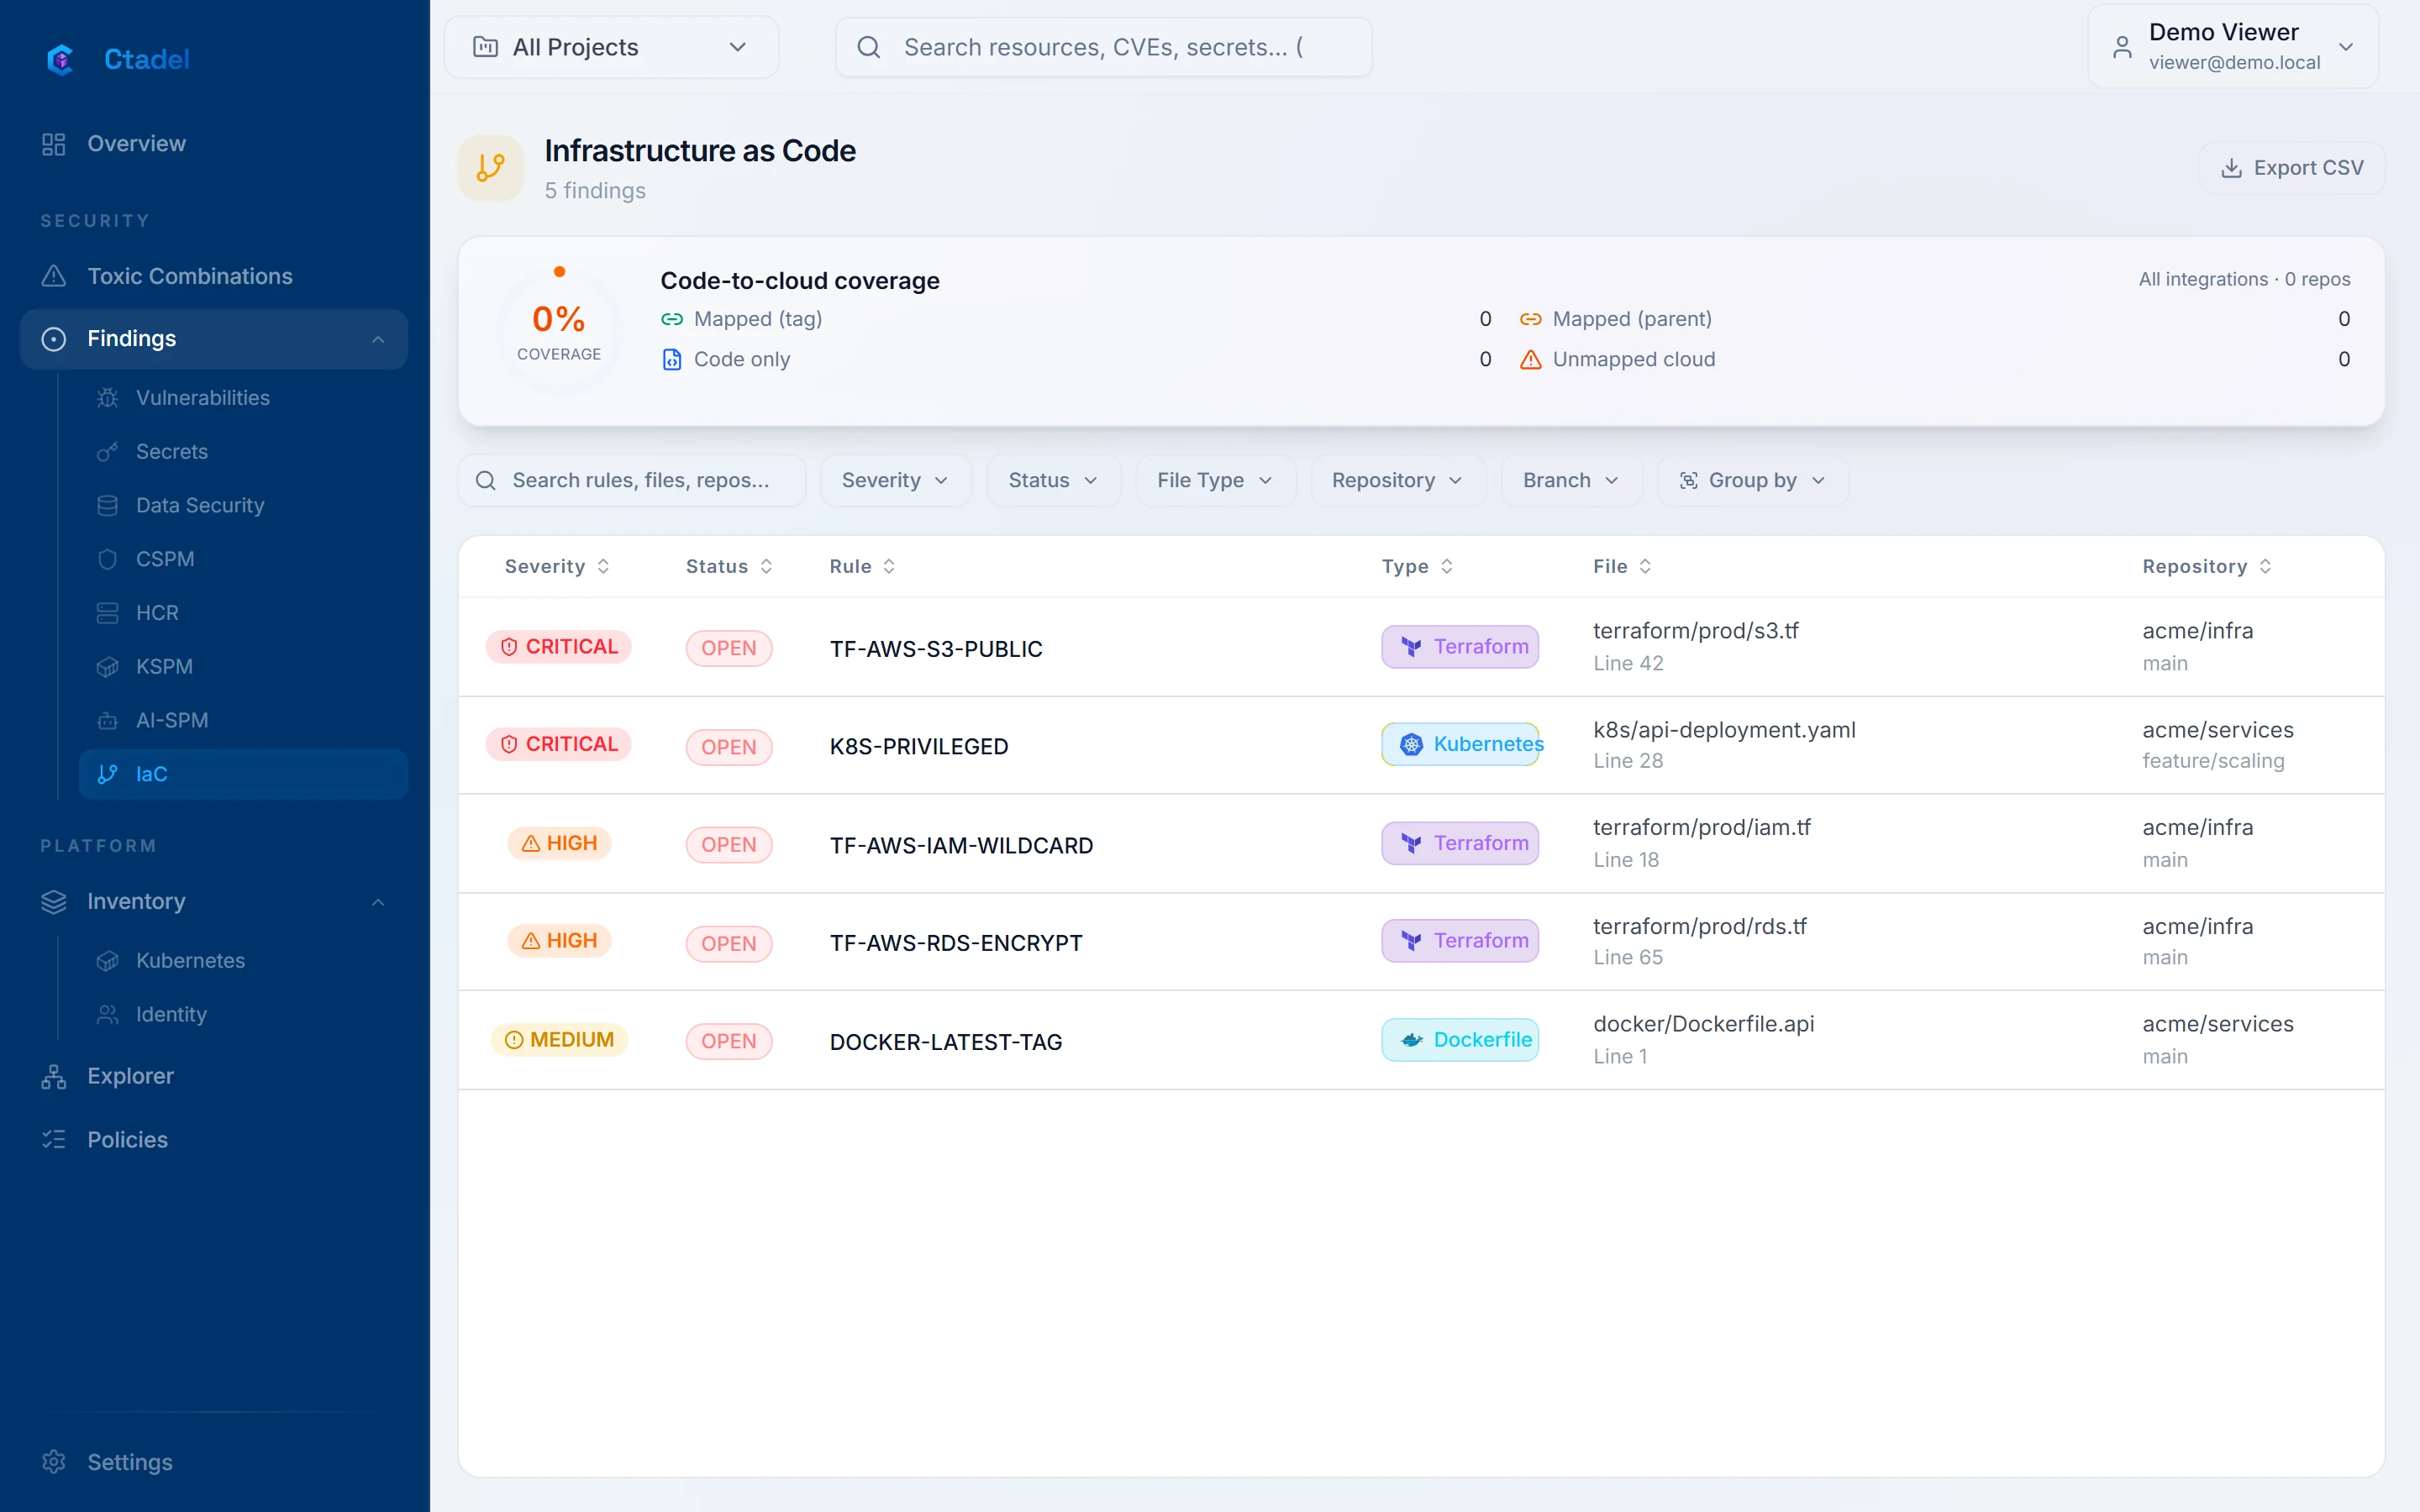
The code before deployment
GitHub and GitLab repositories analysed on every push and pull request: Terraform, Kubernetes manifests, Dockerfiles. The finding points to the line, and drift between code and what is deployed is reported for paired rules.
- 9
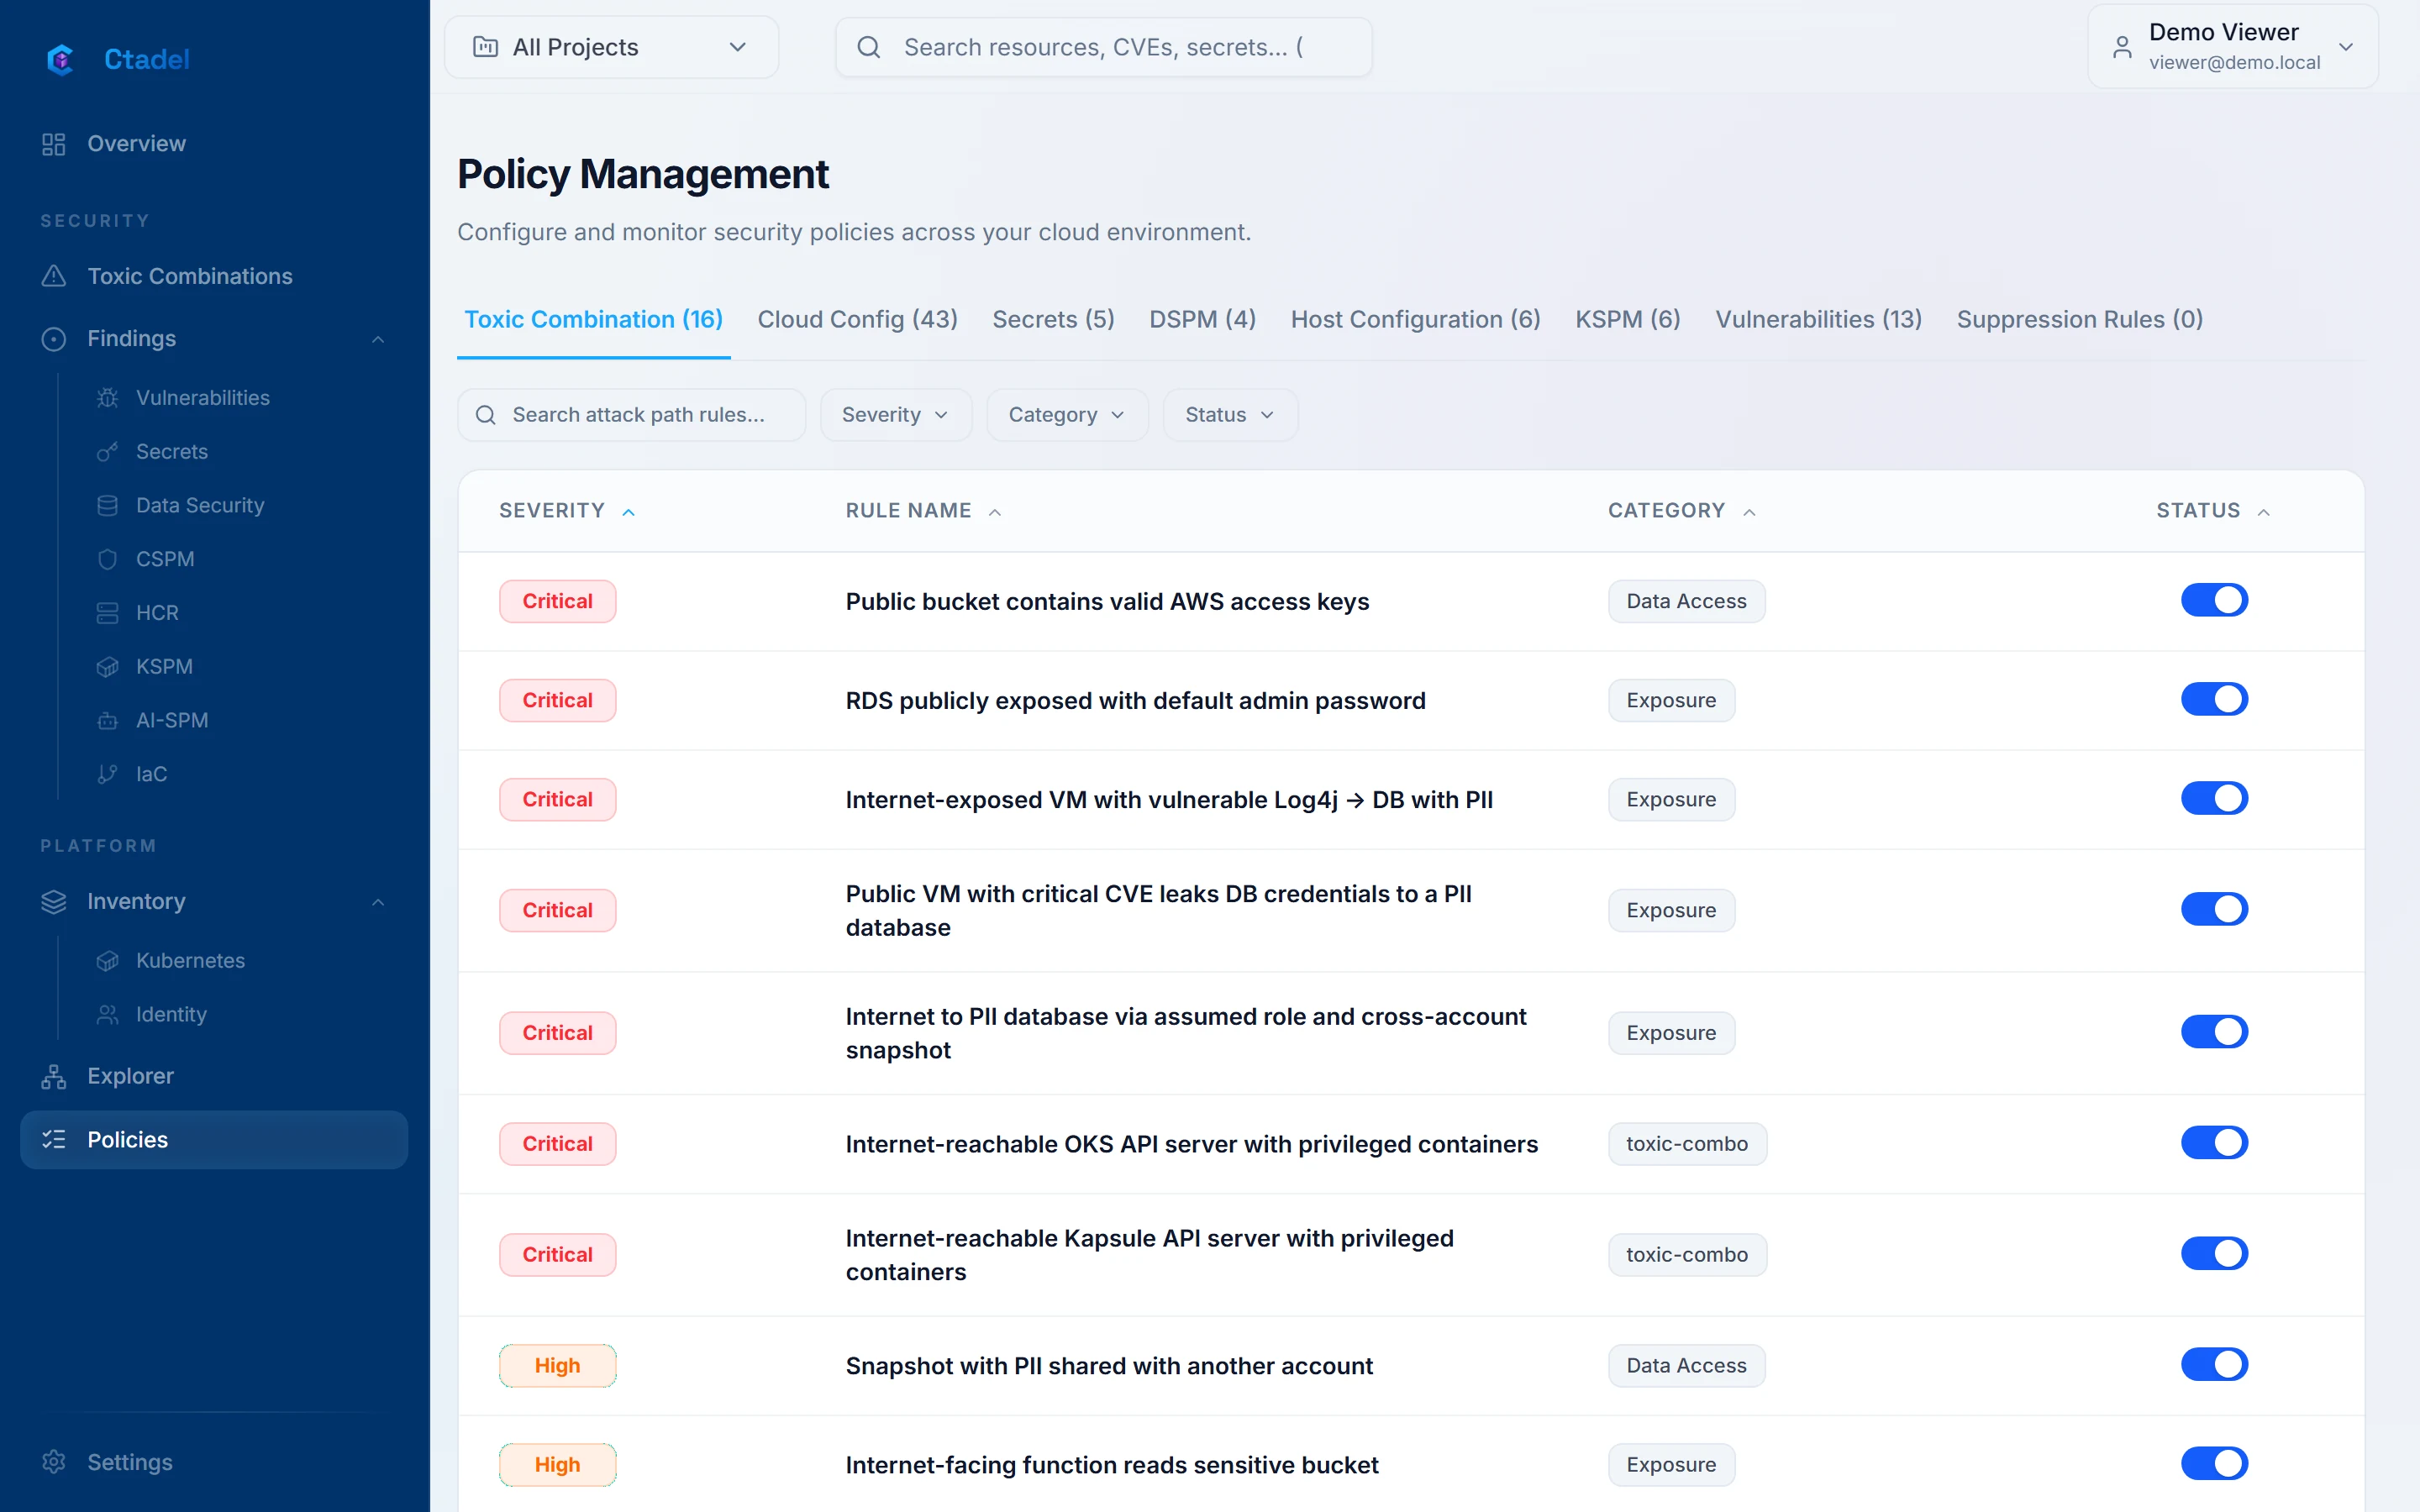
The catalogue, rule by rule
Every rule can be read, enabled and disabled. Those Ctadel disables, because the data is not collected or the signal was never observed, stay visible with their reason.
- 10
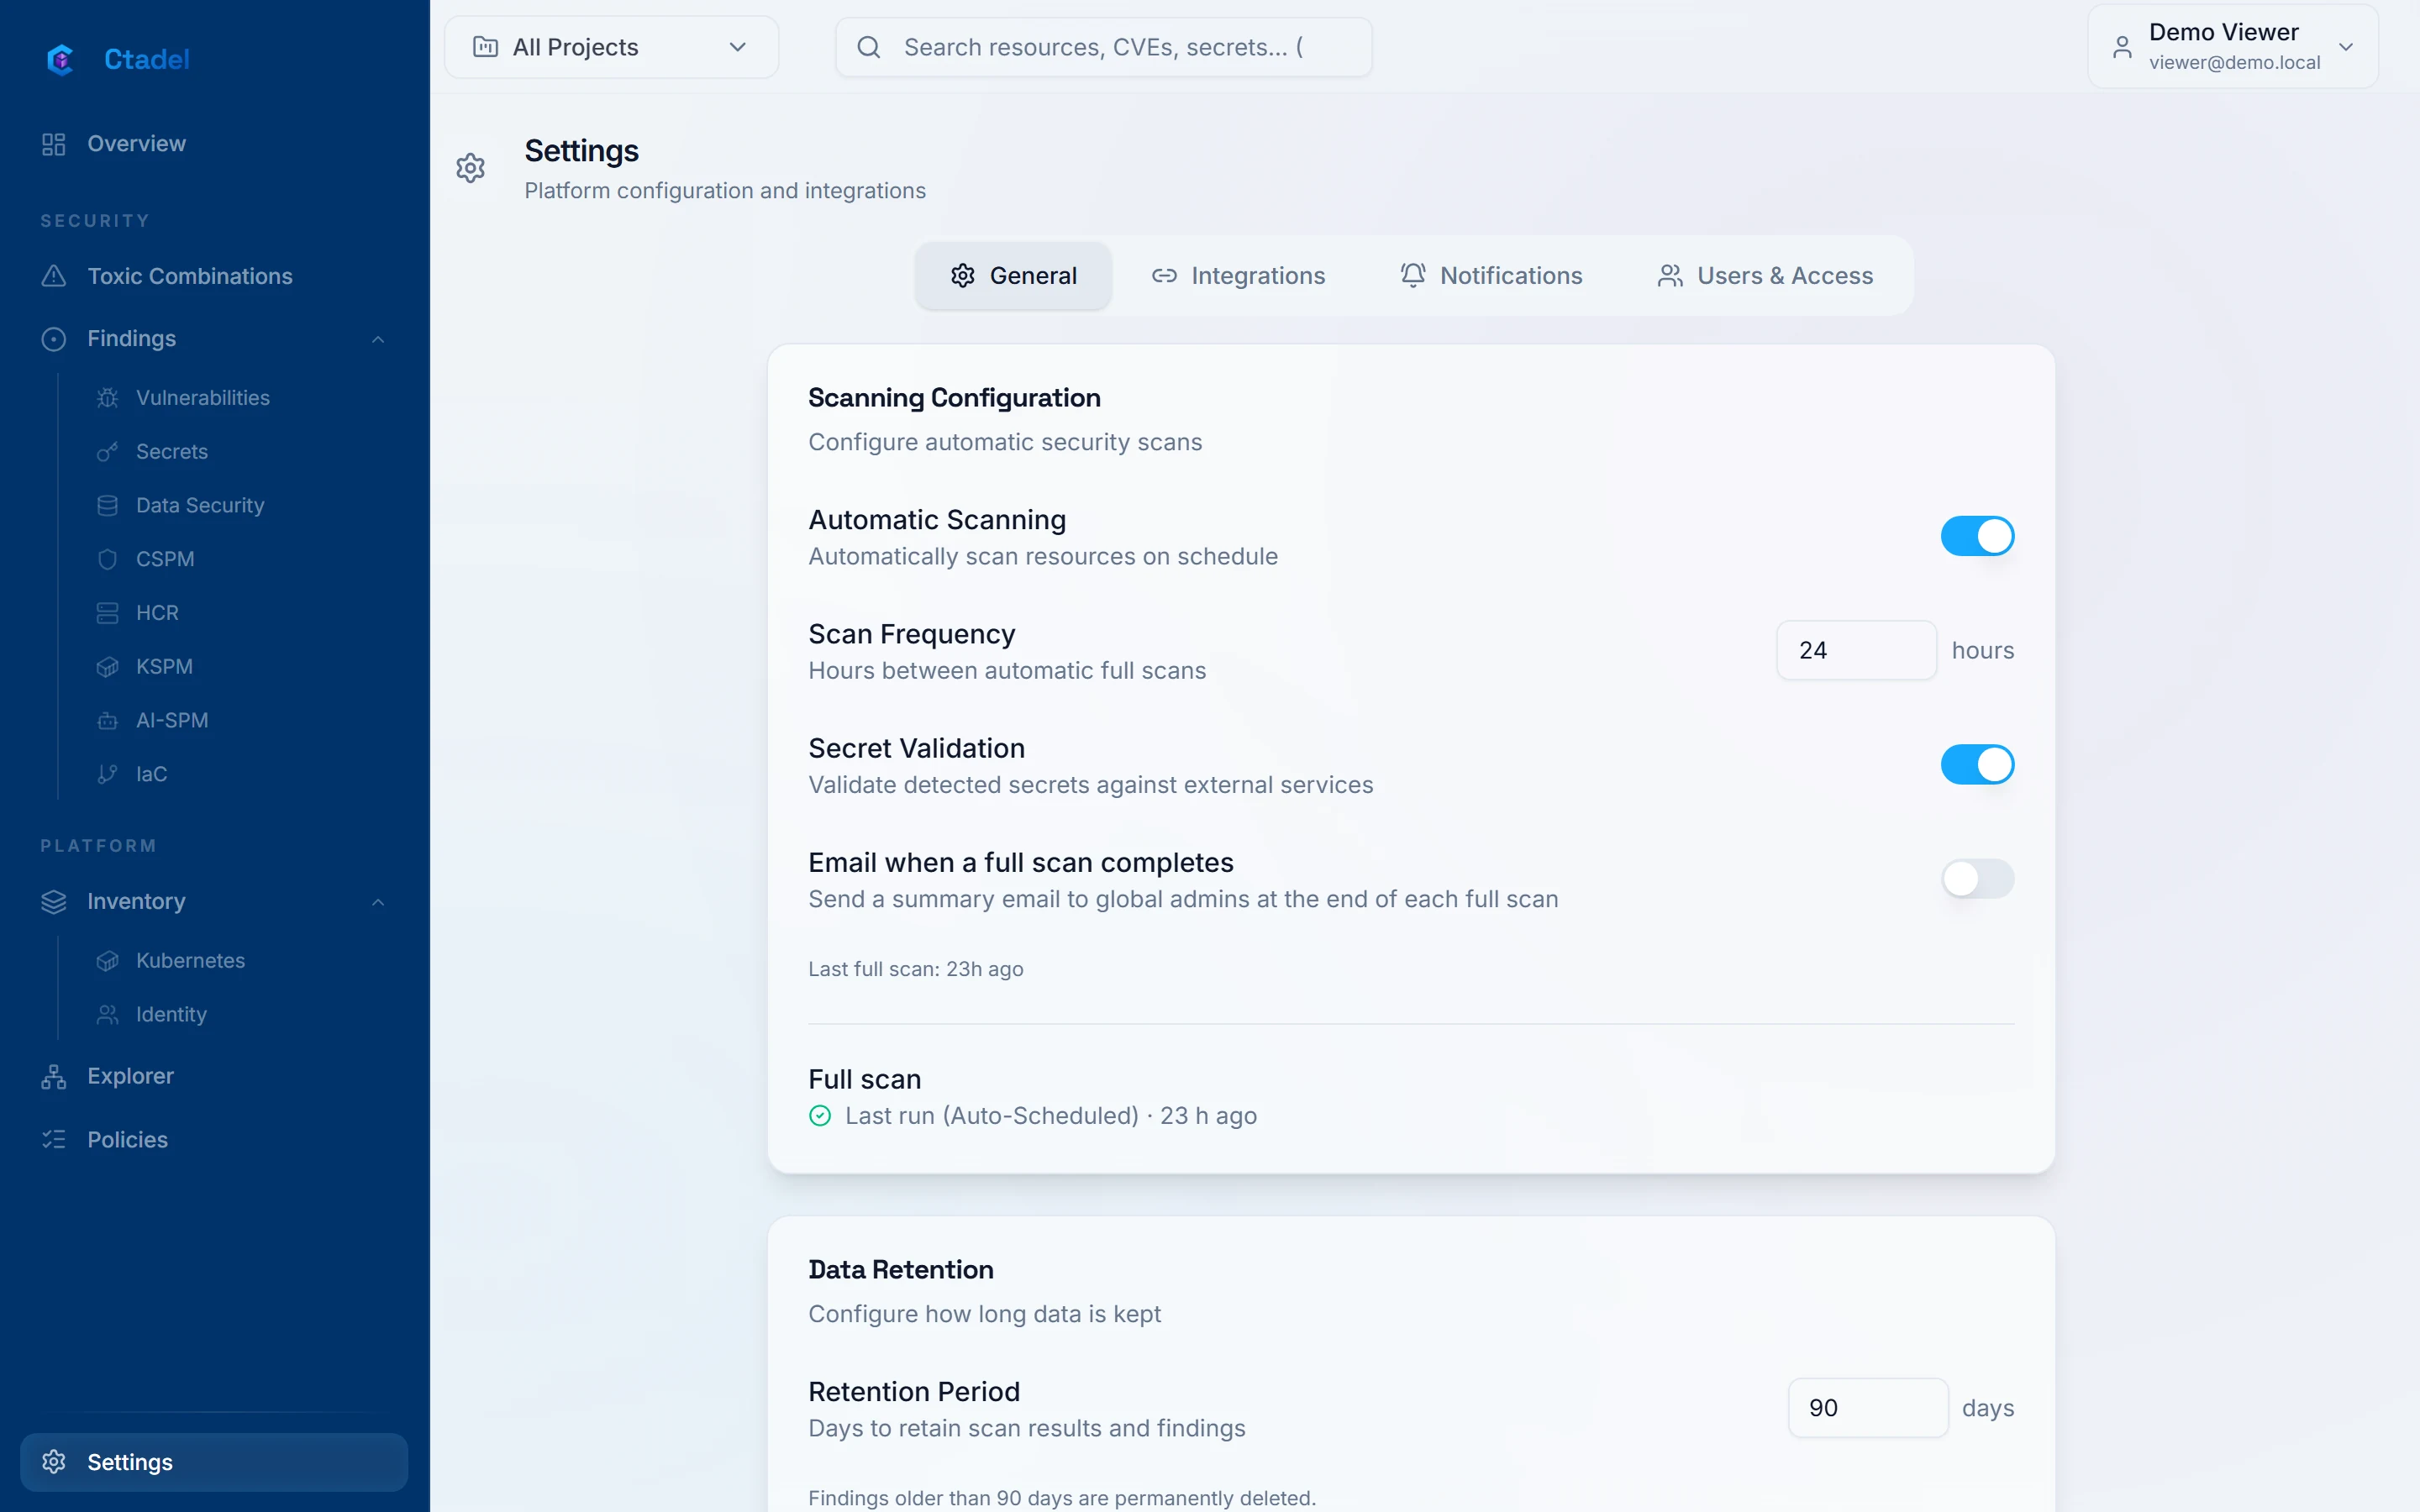
Accounts, team, channels
Cloud accounts and repositories grouped in folders and projects, users and roles, SSO, notification and ticket channels, retention, audit log. Everything that leaves the instance goes through a channel you configure.
And on your accounts?
The public demonstration is open to all, without an account, on fictitious data. For an instance on your own accounts, request a demonstration.